Executive Guide to Forecasting in Manufacturing, Part 6: Causal Models & Predictors
Part of a series reviewing the book Demand Forecasting for Executives and Professionals in the context of enterprise manufacturing.
.png)

.png)
Causal modeling adds predictors (aka drivers, features, indicators) to historical data, that explains variation in your forecast variable (typically demand).
The promise is appealing: if a predictor is known in advance (or can be forecasted reliably), and it brings new information beyond trend and seasonality, it can meaningfully improve accuracy.
But there are traps. Correlation is not causation. A strong correlation does not guarantee a stable relationship. Non-linear patterns can mislead simple coefficient checks. Useful signals available at the wrong planning horizon are useless. And loading models with “interesting” drivers can increase noise, inflate variance, and ultimately reduce accuracy.
In Demand Forecasting for Executives and Professionals by Stephan Kolassa, Bahman Rostami-Tabar, and Enno Siemsen, offer a pragmatic playbook to separate signal from story.

Key Insights from the Book
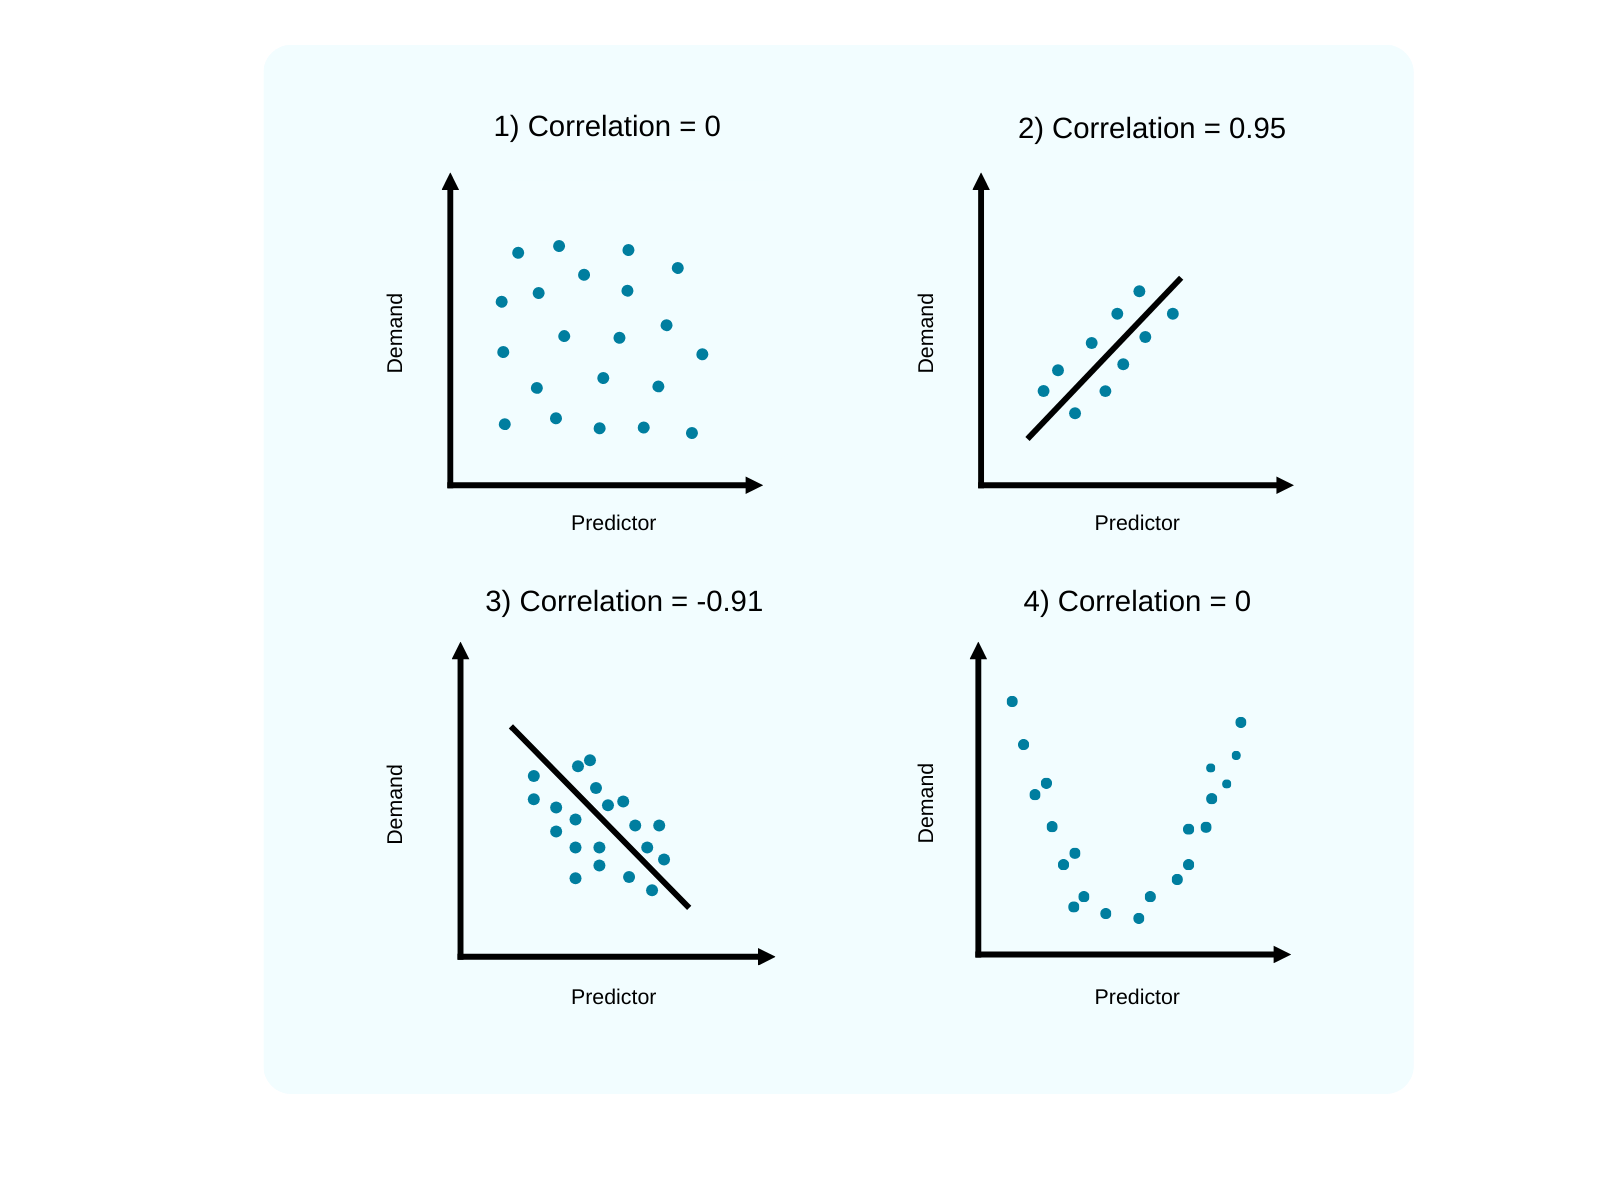
- Association vs correlation.
Correlation captures linear relationships only. But many business effects are non-linear or U-shaped. A Pearson r close to zero doesn’t mean a predictor is irrelevant, it simply means the pattern isn’t linear. Always look at the scatterplot before trusting a number. As seen in the example below, the predictor from the plot 4) has no correlation, but still shows an association with the demand and can be useful to integrate.
- A predictor must add new information beyond the series itself.
If a driver and your demand are both simply seasonal, a well-specified seasonal model may already capture that pattern. The test isn’t “are they correlated?” but “does adding the driver improve out-of-sample accuracy over the best baseline?”
- Availability and horizon matter as much as relevance.
Deterministic drivers (promotions, holidays, list price, planned ad spend) are known ahead of time and are ideal starting points. Stochastic drivers (weather, macro indicators) require their own forecasts; their uncertainty propagates into your demand forecast and must be reflected in evaluation.
- Leads and lags are common plus often asymmetric.
Promotions can boost demand now and depress it next week. “Pre-announced” promotions can depress demand today. Explore lead/lag structures rather than assuming an instantaneous effect.
- Causality is desirable, not required for forecasting.
Forecasting is pragmatic: if a relationship predicts well and proves stable, you can use it. That said, understanding causal structure improves trust and robustness. When feasible, use experiments or quasi-experimental methods to validate key effects.
- Complexity can harm accuracy.
More drivers ≠ better forecasts. Misleading correlations are common in rich datasets. Each added predictor can increase model variance and degrade performance. The right complexity is the one that minimizes total error (bias-variance balance), not the one that explains the past in the most detail.
Quantics Perspective
In our experience, many industrial comapnies try to compensate for uncertainty by adding more external factors into their forecasting models. The intuition is understandable: if demand is influenced by many things, then adding more drivers should improve accuracy.
In practice, however, this often does not happen.
Every additional predictor introduces its own noise, lag structure, and data quality challenges. What appears to be a reasonable business idea can easily degrade forecast quality rather than improve it.
Example: Inflation as a Demand Predictor
Consider the following situation: A manufacturing company wants to improve forecast accuracy and reduce bias at the Region – Plant – Product Group – Product Variant level in order to support smarter inventory and production decisions.
One potential predictor is the inflation rate. The company observes that inflation affects business activity by influencing production costs, pricing strategies, consumer purchasing power, investment decisions, and overall demand patterns. At first glance, adding regional inflation rates to the demand forecast appears to be a reasonable idea.
Let us assume that inflation is indeed a relevant predictor in this specific case. Even then, several practical challenges arise when integrating it into a forecasting model.
Challenge 1 – Inflation forecasts and forecast horizon
Demand forecasts require future values of the predictor. This means the inflation rate itself must be forecasted. Companies may rely on published macroeconomic forecasts or attempt to predict inflation internally.
However, inflation forecasts are frequently revised and often miss turning points. The problem becomes even more pronounced for longer planning horizons, where prediction errors typically increase. As a result, an inaccurate inflation forecast may simply introduce additional noise into the demand forecast.
Challenge 2 – Time lag
Economic effects rarely materialize instantly. If inflation rises sharply in one month, sales will typically not drop immediately. Consumer purchasing behavior and investment decisions often respond with a delay.
This means the model must account for potential lead–lag relationships between inflation and demand. Ignoring these dynamics can weaken the predictive value of the driver.
Challenge 3 – Level of aggregation
Inflation may help explain demand changes at a regional or macroeconomic level, which can be useful for strategic planning or financial outlooks.
However, the operational question for many manufacturers is more granular:
Which plant will sell which product variant in which period?
At this level of detail, the impact of inflation becomes far more nuanced and may not meaningfully improve short-term operational forecasts.
Challenge 4 – Differentiated impact across products
Different products respond differently to economic conditions. Some product groups may be highly sensitive to inflationary pressures, while others may show little to no effect.
A predictor that is useful for some products but irrelevant for others can complicate model design and reduce overall forecast performance if not handled carefully.
A Structured Approach to Predictor Selection
For these reasons, at Quantics we focus on choosing predictors carefully and purposefully, rather than simply increasing the number of inputs.
We support manufacturing clients with tools and processes that make it easier to evaluate potential drivers:
- External data integration. Our data hub provides access to signals such as public holidays, macroeconomic indicators, energy and material prices, and weather data. Clients can also integrate indicators that are already available within their organization.
- Statistical diagnostics. We analyze potential predictors using statistical techniques such as correlation analysis and Granger causality tests, supported by flexible visualization tools.
- Business collaboration & AI forecasting. Together with domain experts from the client organization, we identify indicators that are both statistically meaningful and operationally relevant. Different predictors can be applied at different levels of aggregation, and our AI-driven forecasting engine flexibly accounts for time-lag structures.
- Empirical validation. Potential drivers are tested through rolling out-of-sample forecasts to measure their actual impact on forecast accuracy across different levels of aggregation. Our AI-driven forecasting engine
This ensures that predictors are only retained when they demonstrably improve performance. The goal is not to use more data, but to use the right data.
A Note on Order Book Data
In enterprise manufacturing, the order book is often a highly relevant input, especially for short-term planning. It provides visibility into already committed demand and can significantly improve near-term forecasts.
However, from a modeling perspective, the order book is not a truly external (exogenous) factor. It is influenced by the same underlying demand as sales, and is often shaped by internal processes such as order acceptance, allocation rules, and delivery date promising. As a result, it reflects both market signals and operational decisions.
At Quantics, we therefore do not treat the order book as a external variable in the forecasting model. Instead, we integrate it through a dedicated blending approach, where the system forecast is adjusted after creation based on order book information. This blending accounts for the reliability, timing, and dynamics of both the forecast and the order book, ensuring that adjustments are explainable and support better decision-making.
Practical Takeaways
- Start with reliable, known inputs.
Prioritize predictors that are planned and confirmed in advance, such as promotions, holidays, price changes, trade events, or factory shutdowns. These typically improve accuracy without adding uncertainty. - Validate impact, not just correlation.
Only include a driver if it demonstrably improves forecast performance versus a strong baseline, using out-of-sample testing. - Align predictors with your planning horizon.
Use only variables that are known, or can be reliably forecasted, at the time decisions need to be made. - Account for lead and lag effects.
Demand often reacts before or after an event. Test realistic lead–lag relationships instead of assuming immediate impact. - Limit model complexity.
More predictors do not guarantee better forecasts. Each additional variable must justify its inclusion through measurable value. - Test with realistic data conditions.
If a predictor requires its own forecast (e.g., weather or macro indicators), evaluate it using forecasted values, not perfect hindsight data. - Ensure usability and trust.
When performance is similar, prefer simpler and more interpretable models that can be understood and adopted by the business.
Conclusion
Causal models can turn forecasting from “extrapolating the past” into anticipating the future but only when the drivers are real, timely, and add information beyond your baseline. The book emphasizes a disciplined approach: visualize the data first, validate models out of sample, align them with planning horizons, and keep models simple.
By focusing on predictors that are both explainable and decision-relevant, we at Quantics help manufacturing companies improve forecast performance without sacrificing robustness or interpretability. Even when certain predictors do not increase accuracy, they can still provide valuable context for planning and operational decisions. That is why our solution makes it easy to visualize and explore these drivers.
Disclaimer
In this post, we share highlights from the book “Demand Forecasting for Executives and Professionals” by Stephan Kolassa, Bahman Rostami-Tabar, and Enno Siemsen, together with our own reflections on how these ideas apply to today’s manufacturing supply chains. This is not a replacement for the book, but rather a guide to spark thought and discussion. For a deeper dive, we encourage you to explore the book itself - available here.
Start now
Learn how Quantics contains unique features that can optimally support your manufacturing businesses in unlocking the power of cutting-edge forecasting and supply chain planning.

Frequently Asked Questions
Find answers to common questions about our solutions and how they benefit your operations.